How to read Brain maps
Brain Waves EEG – basic knowledge
Brainwaves are produced by synchronized electrical pulses from masses of neurons communicating with each other. This is the root of all our thoughts, emotions, behaviors and movements. Brainwaves are detected using sensors placed on the scalp. They are divided into bandwidths to describe their functions (below), but are best thought of as a continuous spectrum of consciousness; from slow, loud and functional – to fast, subtle, and complex.
It is a useful analogy to compare Brainwaves with musical notes. The low frequency waves are like as if someone hits ab big drum maybe once per second, while the higher frequency brainwaves are more like a violin playing high tones. Like a symphony, the higher and lower frequencies link and cohere with each other. A frequency then is simply the amount of cycles per second. Low frequencies are Delta, Theta and Alpha, high Frequencies are Low Beta, Beta, High Beta and Gamma.
In more detail the Electroencephalogram shows the electromagnetic activity which is formed by polarization and depolarization of neurons. These all happens in cycles which occur several times per second. The cycles show up as waves in the EEG. The neurons in the brain have the capability of emitting and receiving electromagnetic and chemical signals from our body and from our environment.
Our brainwaves change according to what we’re doing and feeling. When slower brainwaves are dominant we can feel tired, slow, sluggish, or dreamy. The higher frequencies are dominant when we feel wired, or hyper-alert or starting to experience the higher energy when getting into higher consciousness during meditation.
The descriptions that follow are only broadly descriptions – in practice things are far more complex, and brainwaves reflect different aspects when they occur in different locations in the brain.
Brainwaves are characterized through two basic components: speed and amplitude (also power or strength).
Brainwave speed is measured in Hertz (cycles per second) and they are divided into bands delineating slow, moderate, and fast waves.
How “loud” is your Frequency?
EEG is particularly interesting when it comes to the amplitude of a given frequency. Like as if you hear a nice tone, you are also interested in the intensity of this tone, or how loud it is. EEG waves can have a high level or lower level of intensity, dependent on how many neurons fire in the same frequency. Like in an orchestra: the more instruments playing the same tone, the louder it gets. The term used for intensity is “amplitude”. Each frequency has its own amplitude which is measured in Microvolt and this amplitude is varying depending what you think, whether you are relaxed or stressed, sleeping or just daydreaming, whether you feel depressed, feeling anxious or having a good mood. These amplitudes can also show a general trait: you may have too much or too less amplitude of a given frequency or your brain just maintains an amount that keeps you staying in a state of healthiness and wellbeing.
It´s also important to know that your brainwave activity is flexible and adapts to the tasks and demands of your daily life. So, if you are seeing changes in the brain during meditation for example this is always a sign of flexibility and mostly a good sign of your brains ability to show different levels of activation.
This is why we like to use quantitative EEG measures, because the QEEG gives us the information about how loud an instrument plays, whether it´s too loud or not loud enough – shortly said: is the energy of a given activity on its optimum level?
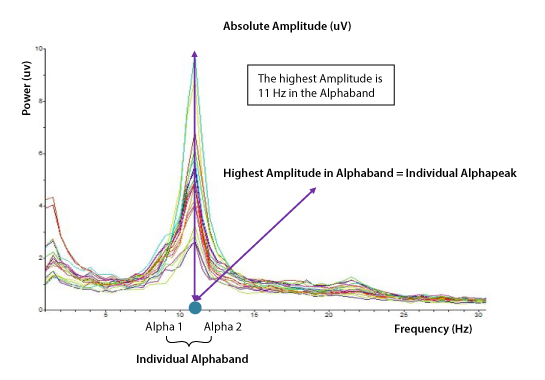
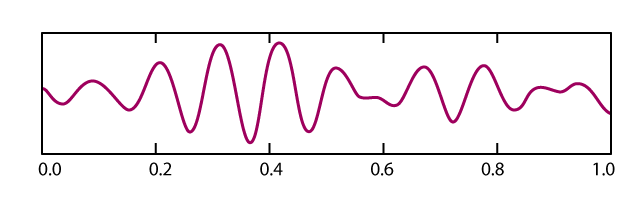
Spectral analyzing interpretation of electroencephalogram alpha activity
The spectral analysis shows the average Amplitude power in the different frequencies and frequency bands. The Amplitude power is measured in microvolts (uv) and the frequency of brain waves in Hz – oscillations per second. This gives a very quick overview of your meditation state. The different states of meditation are Alpha state – Theta state – Delta state – Gamma state.
Example of a spectral analysis
When you are going into Meditation
This is the time when the Alpha waves and / or Theta waves are synchronizing and your brain is moving into the so called dominant rhythm. This is one of the first signs for entering the meditative state.
The more practice you have the faster you enter this state.
Time to enter the Meditative State – YOUR TIME = 1:19 min
SHORTER THAN AVERAGE = LESS THAN 1 MINUTE (highly skilled meditator)
AVERAGE = 1 TO 2 MINUTES
LONGER THAN AVERAGE = 2 TO 3 MINUTES
Brain Wave Frequencies – opening the door to Meditation
INFRA-SLOW Fluctuations (<.5HZ)
These waves are thought to be the basic cortical rhythms that underlie our higher brain functions. Very little is known about infra-slow brainwaves. Their slow nature make them difficult to detect and accurately measure, but they appear to take a major role in brain timing and network functions. We do not measure these waves during meditation and their role for meditation has not yet been studied enough to give information about them. Infra-Slow-Fluctuations can be used for Neurofeedback though and have an impact on the autonomic nervous system. The Institute for EEG-Neurofeedback teaches workshops in the clinical application of the infra-low-fluctuations.
DELTA 1-4 Hz
Delta waves are usually responsible for deep sleep, dreamless state. They are also in seen in Meditation, are involved in processes of automatic self-healing and relate to good immune system function.
Tibetan monks who have been meditating for decades can reach this in an alert, wakened phase, but most of us reach this final state during deep, mostly dreamless sleep. So the stand for both: The unconscious or the Supra-Conscious mind.
State of bliss – Advanced meditation practices and yogic traditions have associated the delta brainwave frequency range with a feeling of all-encompassing bliss. Most people aren’t able to experience the delta brainwave state while they stay conscious. Only few people can experience to feel extreme bliss from the delta waves like the yogis, monks, or advanced meditators.
Delta wave activity is also associated with the release of anti-aging hormones. They stimulate the release of melatonin and DHEA, two powerful anti-aging hormones. Studies have shown, that this is also associated with decreased levels of cortisol – which is a stress hormone that has been scientifically proven to correlate with stress and so are correlated to aging faster.
Delta waves may also show an advanced state of empathy, understanding, and compassion for others.
The goal of many meditation practices is to increase the amount of slower brainwave patterns. Usually, after practice, meditators are able to become consciously aware in the alpha, and possibly the theta brainwave ranges. Experienced meditators are more and more able to recognize and control their state of awareness and brainwaves.
Delta brainwaves are also abundant in new born infants, young children, people with ADD or ADHD, people who have had near death experiences, or people who have experienced head injuries. So it is important to have a closer look not only at the waves but also of the history of the meditating subject.
THETA Waves 4-8 Hz
Theta brainwaves, occur in light sleep, including REM dream state. They are also abundant in deep meditation. Theta waves allow intuition, memory consolidation and vivid visual imagery. They are our gateway to learning and memory. In theta, our senses are withdrawn from the external world and focused on signals originating from within. It is that twilight state which we normally only experience fleetingly as we wake or drift off to sleep. It’s where we hold our ‘stuff’, our fears, troubled history, and nightmares.
Research shows that experienced meditators are characterized by increasing their Theta (4-8 Hz) and lower alpha (9-10 Hz) frequencies in the brain.
This is the point where the verbal/thinking mind transitions to the meditative/visual mind. We begin to move from the planning mind to a deeper state of awareness (often felt as drowsy), with stronger intuition, more capacity for wholeness and complicated problem solving. The Theta state is also associated with visualization.
Theta brain waves are slow and relaxing brainwaves that are usually associated with us when we sleep and are dreaming. Located in the right hemisphere of the brain, they usually arise when we are dreaming, sleepy, emotional, relaxed or daydreaming. Although we all possess theta brain waves, they are most commonly accessible for people that struggle with ADD, or those that dream in a very relaxed state. Artists are known to have frequent theta brain waves as well as any other highly creative individual. Whenever we are really and truly relaxed, dreaming in a deep slumber or creatively thinking, we may be utilizing theta brain waves.
Frontal midline Theta.
In a meditation that involves monitoring of ongoing experience without high levels of control or manipulation of the contents Theta in the middle of the frontal lobes can show a higher amplitude than usual and so we expect your Theta to come up higher in amplitude when meditating.
Artists
Since the brain under Theta waves operates at a much slower rate, there can be many benefits to our emotional state of mind. Musicians, sculptors and artists of many genres do often have more theta brain waves than other individuals. So, Theta is also a door the undiscovered realm of creativity and offer a superior problem solving capacity, because the mind is no longer under charge and pressure. Given this freedom the person feels more relaxed and calm. Also, some drugs are used to produce this comfortable Theta-State.
Solution to reduce Stress
In our Neurofeedback praxis, we help the brain to produce more Theta waves as this has a great effect of relaxation and clients feel much more connected to themselves and others. Not only that they feel calmer, they become more empathetic and less neurotic and less anxious. All this is good starting point for being better prepared for the meditation process and doing your work, resulting in less mind chatter, less negative thoughts, improvement of spiritual awareness and insight.
Concentration and Awareness
But there are not only good things associated with Theta. People with ADD also often have a higher amount of Theta wave activity, which makes them a lot of trouble focusing. Attention Deficit Disorder creates a difficulty to concentrate on one thing for too long, and the contribution of theta brain waves can make it increasingly difficult to focus. Another downside of theta brain waves can also produce feelings of depression until you move into the beta or alpha range. Boredom is a common feeling experienced with theta brain waves; however, if you experience boredom or become uninvolved with life’s usual activities for too long, you may want to think about contacting your doctor.
Depression
– is quite common with people that have large amounts of theta brain waves, and if this is the case with you, it’s important to be very cautious about symptoms you exhibit. For example, if you have a loss of appetite, become highly impulsive or stop finding joy with the activities you normally enjoy, you may consult a professional. Meditation can help to calm your brain waves, especially when done on a regular, daily basis. Do those things that make you feel good and enhance your creative mind: meditate, paint, play a musical instrument, listen to music, enjoy art to increase your theta brain wave activity. All this contributes to more productivity, creativity, the improvement of your memory and to maintain a good state of neuroplasticity.
ALPHA 8-12 Hz
Alpha waves are present at different stages of the wake-sleep cycle. The most widely researched is during the relaxed mental state, where the subject is at rest with eyes closed, but is not tired or asleep. This alpha activity is centered in the Back of the head and is presumed to originate there. Alpha wave activity is also found during REM sleep. As opposed to the awake form of alpha activity, this form is located in a frontal-central location in the brain.
Because of alpha waves‘ connection with relaxed mental states, increase in alpha wave activity is a desirable outcome for some types of biofeedback training. EEG can be used to provide the subject with feedback when alpha waves increase, enabling some individuals to consciously increase alpha wave activity. There are several different prospects of this training that are currently being explored. Arguably, the most popular one is the use of this training in meditation. Zen-trained meditation masters produce noticeably more alpha waves during meditation. This fact has led to a popular trend of Biofeedback- or Neurofeedback-Training programs for everyday stress relief. In our clinics, we are successfully using this technique to help people overcome phobias, calm down hyperactive children, and help children with stuttering problems to relax enough to practice regular speech. It also integrated with good effects, to facilitate meditation and overcome mind chatter and distraction.
There are other uses of biofeedback training beyond therapy. Defense Department researchers are exploring biofeedback as a way of getting captured soldiers to create alpha waves, potentially foiling enemy lie detectors.
When Alpha brain waves start to rise, we slow down the mind and helping the autonomous system to switch into the parasympathetic mode.
How to increase your Alpha waves.
Alpha waves are a great gift to every one of us. We feel more calm, peaceful and grounded. We often find ourselves in an “Alpha State” after a Yoga class, a walk in the woods, a pleasurable sexual encounter or during any activity that helps relax the body and mind. We are lucid, reflective, have a slightly diffused awareness. Also, the hemispheres of the brain are more balanced. Meditation is a good way to increase Alpha waves. If you want to become more calm and balanced it is useful to meditate on a regular basis to maintain the effects and also become more reflected and calm in a stressful situation.
BETA 12-35Hz
Beta brainwaves are present in our normal waking state of consciousness. Beta waves occur when the brain is working on goal-oriented tasks, such as planning a date or reflecting actively over a particular issue. So, Beta brain waves dominate our normal waking state of consciousness when attention is directed more towards cognitive tasks and the outside world. Beta is a ‘fast’ activity, present when we are alert, attentive, engaged in problem solving, judgment, decision making, and engaged in focused mental activity. Beta brainwaves are further divided into three bands; Lo-Beta (Beta1, 12-15Hz) can be thought of as a ‚fast idle, or musing. Beta (Beta2, 15-22Hz) is high engagement or actively figuring something out. Hi-Beta (Beta3, 22-38Hz) is highly complex thought, integrating new experiences, often anxiety, or excitement. Continual high frequency processing is not a very efficient way to run the brain, as it takes a tremendous amount of energy.
So, the Beta State is associated with the alert mind state of the prefrontal cortex. This is a state of the “working” or „thinking mind“: analytical, planning, assessing and categorizing (neural integration).
EEG usually shows a few beta waves during meditation and resting. So, actually, we do not expect a heightened amount of Beta-amplitude in the brain during meditation as it is often correlated with mind chatter, and a feeling inner restlessness. However, our research and those of others has shown that higher amplitudes of the Beta-bands can be seen as predecessor of Gamma which is the highest frequency in the brain we can measure.
Our brain produces attention while it operates in the beta1 frequency. But Beta1 bursts help to shift the system to an attention state that consequently allows for Gamma synchronization and perception (Wrobel, 2000). Beta1 activity has also been associated with binding of sensory qualities into a
unified perception, such as the integration of visual and auditory information.
GAMMA Wave 35 – 45 Hz
Gamma brain waves are oscillating between 25 Hz and 100 Hz, 40 Hz are normal and typical in humans. Gamma waves were essentially unknown before the development of digital recorders, since the old Ink EEG-Writing devices where not fast enough. Today Neuroscientists are beginning to discover the realm of the brain when it produces the Gamma frequency.
Gamma brain waves are considered the fastest brainwave frequency with the smallest amplitude. Astonishing fact: during meditation they can become the frequency with the highest amplitude. They are associated with the “feeling of blessings” reported by experienced meditators such as monks and nuns, and with peak concentration and extremely high levels of cognitive functioning. Our test persons talk about similar experiences: a feeling like coming home, feelings of wholeness and love are also reported.
Neuroscientists showed evidence that gamma waves are able to link information from all parts of the brain. Gamma originates in the thalamus and moves from the back of the brain to the front and back again. It seems that the entire brain is influenced by the Gamma waves. This rapid “full sweep” (40 Hz) action makes the gamma state one of a peak mental and physical performance. Gamma is also the brainwave state associated of being “in the Zone,” a feeling as if you can do anything.
Every human being can produce Gamma brainwave activity, but what makes the difference, is the amount of Gamma amplitude that is produced. Low Gamma activity has been linked to learning difficulties, poor memory and impaired mental processing.
High gamma activity also corresponds to a state of peak performance. Elite athletes, top-notch musicians and high achievers in all fields produce far more gamma waves than average.
So, it´s evident that a high amount of Gamma has many advantages:
- increased memory recall (the 40 Hz frequency is known to regulate memory processing);
- increased sensory perception. Senses are heightened when the brain produces gamma waves. Like you may have heard in Dr. Joes Lectures: food tastes better; vision and hearing sharpen; sense of smell becomes more powerful; and your brain becomes far more sensitive to all sensory inputs from your environment. Why not having a much richer sensory experience and a much better perception of what happens around you as a person.
- your brain on Gamma is able to process all sensory information faster with a greater sensitivity.
- people with higher Gamma activity can recall a lot more about any memorable event: like the food they ate, the music they heard, the conversations, the names of people they met, the air temperature, and many more.
- Advantage of higher processing speed: the brain is able to process a much greater amount of information quickly, remember it, and retrieve that memory later.
- People with high gamma activity are naturally happier, calmer and more at a feeling of inner peace.
- Compassion comes from a feeling of one-ness with all creation. This is the “feeling of blessings” and ecstasy that accompanies high levels of gamma brainwave activity not only during meditation.
Something remarkable happened when the monks in a study were asked to focus on feelings of compassion: their brain almost became dominant of Gamma frequency in a very rhythmic and coherent pattern.
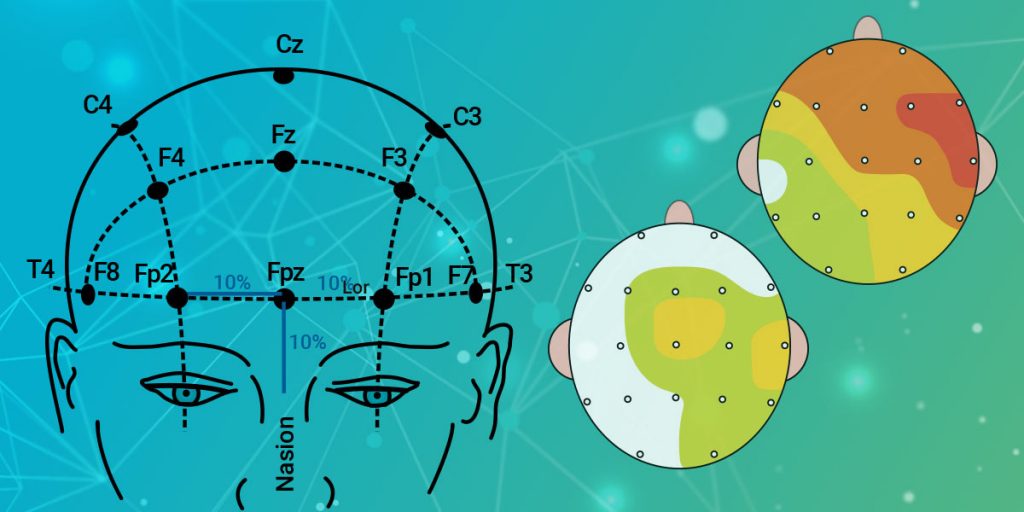
What is a Brain map of quantitative EEG (QEEG)?
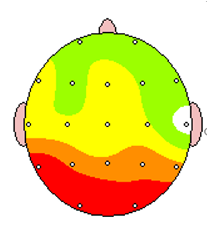 In quantitative EEGs we simply show measures of brain activity and show not only how much there is, but also show where the activity occurs. All the calculated measures are just transferred to a topographic surface in a 2-D map. This can be shown in Raw Scores and in Z-Scores. Be careful with artifacts: some of the values maybe very high and look as if they are beyond good and evil. But as the signal from the brain is very tiny (EEG is measured in microvolts – a millionth of a volt) a muscle activity or an eye blink can cause huge deviations that are of course not the origin of the brain.
Key skill to read and interpret Brain Maps
The colors indicate the Z-Scores. White is between -1 and +1 considered to be in the range of a normal healthy population matched to your age.
Brain maps give a quick survey of what is happening in the brain. Interpretation has to be done very careful to avoid misinterpretations.
What is a Z-Score?
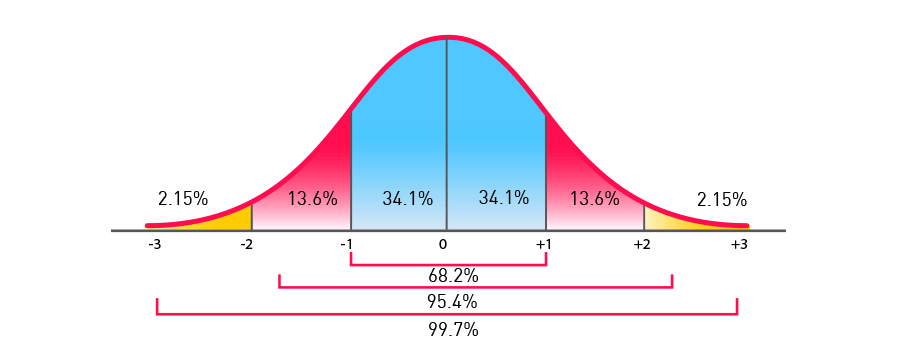
A Z-Score is a normative statistical measure used to define a statistical average in a population, which is measured by the so called “standard deviation”. A Z-score is nothing else than a transformation of a Raw Score into a Z-Score to show how far it is away from the average and then to make comparisons. Normative measures always give a range found in the majority of people (68,2 percent). Because average cannot just be the mean – the majority is gathered around this mean which has the value of “0”. So, an optimal performance of an individual can be found inside but also outside of the range of average. It’s like having a high IQ of 145 that is out of the range of the average. This doesn’t mean it’s too high. It’s just higher than average. The same with lower Z-scores. There are people smaller than average, but that doesn’t mean they are too small. It still depends on what you are and not what you have. But several patterns have a higher correlation and some less. We found Z-scores very helpful in identifying the patterns of normal awake state and meditation. Of course, a brain under meditation cannot to be compared with a normal. You may have done 10 meditations in the workshop and of course this will alter your Z-Scores. Keep in mind that there are no Z-Scores for meditation, as every meditation style causes different patterns. But we found it very helpful to use those Z-Scores as they show us the changes of the brain activity in a certain area of numbers which makes is also more transparent to the meditators to see their changes before, during and after meditation.
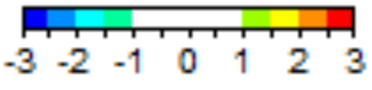
The scale the z-scores ranges usually from -3 to +3, whereas higher values also can be found. In the map this numbers are color coded meaning that for example dark blue is 3 standard deviations (SD)
below 0, light blue 2 standard deviations below normal, white is baseline normal, light green registers at the outer area of normal but is considered 1.0 to 1.5 SD above the mean value, yellow is 1.5 to 2.0 SD, orange is 2.0 to 2.5 SD above mean value, red is up from 2.5 SD above mean value.
In our Brain maps, we use 5 different measures:
- Z-Scored Absolute Power
- Z-Scored Relative Power
- Z-Scored Amplitude Asymmetry
- Z-Scored Coherence
- Z-Scored Phase Lag
- Z-Scores Single Hertz
What do the Brain maps of Z-Score Absolute Power show?
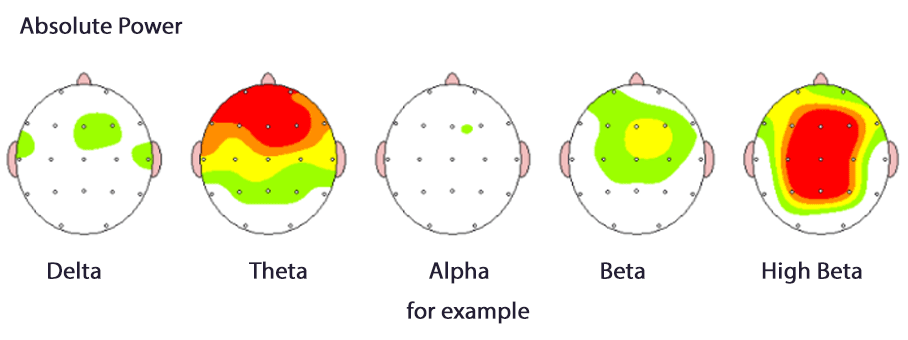
The Z-Scored power is the amplitude of a frequency compared to a normative population value. The Z-scored Power shows the standard deviation in numbers and not in microvolts. Scientists use the term power because it is squared in the formula that precisely calculate the values. In the maps everything which is white is in a normal range. Red reveals that the amplitudes of Theta and High Beta are 3 standard deviations above average. This is not normal but can also be the result of a deep and profound state in meditation. Theta can become very high during Meditation and so High Beta as it is coupled and so this could be a predecessor of Gamma. If this person was not meditating we would probably say the person has a dysregulated brain.
What do the maps of Z-Score Relative Power show?
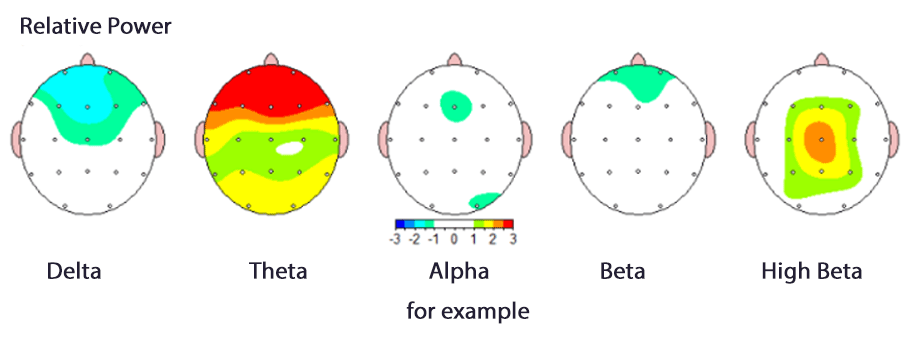
Relative Power shows the amplitude of one chosen frequency compared to all other amplitudes of all the frequencies measured in one sensor placement of the EEG-Cap. Absolute Power must be considered to evaluate the Relative Power. In the example, you see there is a low Relative Power in Delta on the frontal lobe which is indicated by the blue color. Sometimes it is very useful to look at relative distribution of the frequency bands as it can show which band carries the dominant activity in the brain and can thus give us an information about the dominant state of the participant.
What do the Maps of Z-Score Asymmetry show?
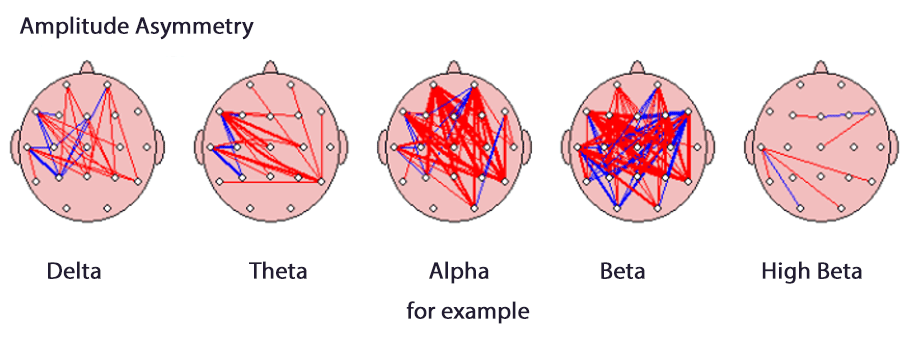
Asymmetry is a measure of how much two electrode locations differ in amplitude from each other. The thicker the lines the greater the difference compared to the average of a healthy population.
Blue and Red lines are not differentiated. Just the thickness of the lines is important. Sometimes this can be influenced by artifact as a high amplitude difference can easily be caused by eye blink or other movement. In the example above there is a high amplitude asymmetry in the Alpha band front to back and high asymmetry in the Beta band front to back shown by the lines in the Amplitude Asymmetry Brain maps.
We consider Amplitude Asymmetry not very significant for evaluation.
What do the Maps of Z-Score Coherence show?
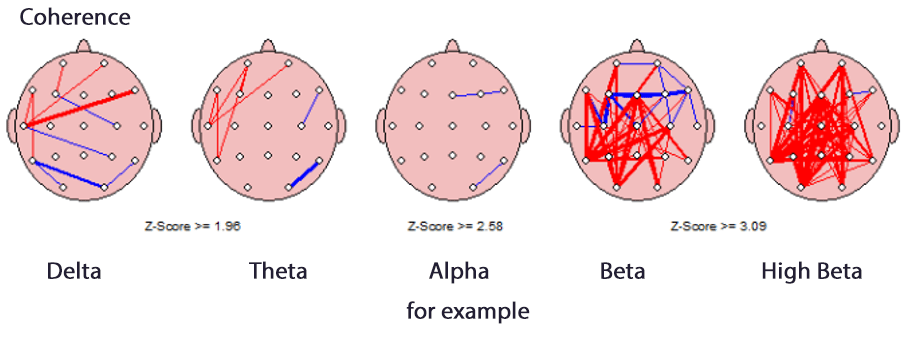
Coherence is a simply said a measure of communication and connectivity among neurons in different regions of the brain.
In our statistical report the red lines represent hyper-coherence, which means that there is intense communication between these regions or parts of a neuro network.
The red lines in your report may represent hyper-coherence, which show that these regions of the brain communicate more with each other. The blue lines in your report may represent hypo-coherence, which show that these regions of the brain communicate less with each other.
The thicker the line the higher the standard deviation or the Z-score. The thickness of the line relates to standard deviation (SD). The thinnest line is registered at 1.96 SD, the medium thick lines are at 2.58 SD and the thickest lines are at 3.09 standard deviations (SD)
Please also consider that there is hardly a good or bad coherence. Hyper coherence is seen very often in deep states of meditation and so it is absolutely welcome to have a hyper connected brain. But if you have this pattern during you are sitting in your office and want to work on a project this may not be the appropriate pattern.
What do the Maps of Z-Score Phase-Lag show?
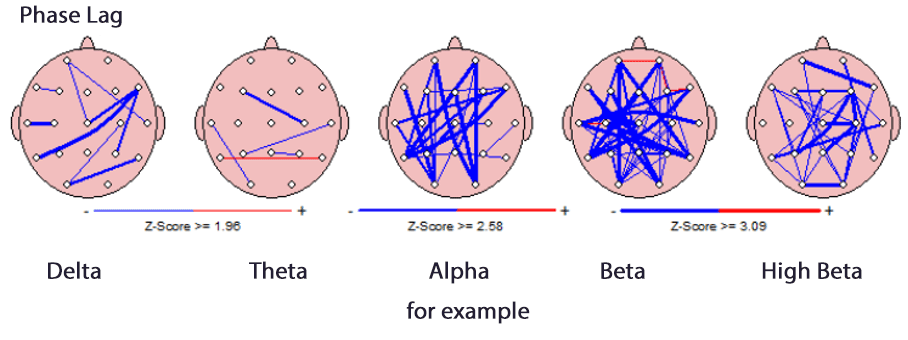
Phase Lag is also like coherence a measure of connectivity in the brain. In simple words, we measure how fast the information is transferred from one point to another. Whereas speed is not always better – there are norms. Blue lines indicate “too fast” and red lines indicate “too slow”. Please also keep in mind that under meditation, the brain can behave very much outside normal values. Meditation research shows hardly any data on Phase Lag, so we do not keep this into our evaluation until we have more data.